We recently released a tool at http://cc.thinkst.com to capture and collect infosec conference details. We commented on it [here]. One of the cooler components of it, is the ability to view the relationships between speakers/researchers who have collaborated. This post is a quick introduction to the library we used to build our graphs, with enough info to get you up and running in minutes.
As I mentioned, we use ArborJS library which is a a graph visualization library using web workers and the popular jQuery.
The API is really well documented [here] but like most people, I learn best by example (and there are precious few of these). Hopefully this post will fill that niche, and by the end of it you should have a basic understanding of how to use arbor.js in your project.
Our Aim:
We will be building a simple contrived example as seen in the image above.
Project setup :
Create a new html page and include script references to the following libraries (Download them from the links provided and host locally):
jquery : googleapis
arbor.js : github
graphics.js : github
renderer : github
(Feel free to download the arbor.js repository and investigate the source to poke at it’s innards.)
Next add a canvas element to the body of the page:
<canvas id="viewport" width="800" height="600"></canvas>
Finally (below your canvas) create a script tag:
<script language="javascript" type="text/javascript"></script>
At this point you are now setup and ready to start creating your own graph in arbor.js.
Your page source should look like this at the moment:
In the script tag below the canvas element add the following code :
var sys = arbor.ParticleSystem(1000, 400,1);
sys.parameters({gravity:true});
This does 3 things:
- Initializes the arbor system;
- Sets up the renderer to use the canvas element we provided;
- Adds an animals node the the page.
The particle system tells arbor how much you want things to move around. (If you set the 3rd parameter to 1, nodes will not move around at all unless you drag and drop them). You can play around with values between 0 and 1 to see how flexible or rigid the graph becomes.
Next add :
sys.renderer = Renderer("#viewport") ;
This initializes the renderer which is used by arbor.js to draw the nodes on screen. If you want more advanced shapes or pictures you need to edit the renderer file to provide this functionality. The file that we linked to provides 2 basic shapes the dot and the rectangle to get you started off.
Next add :
var animals = sys.addNode('Animals',{'color':'red','shape':'dot','label':'Animals'});
In the line above we added a node to the graph, this is the first node and will be our parent node (to which all other nodes are connected to).
The first parameter is the node name and is what is used to reference a node at any later stage. The second parameter is a JS object that describes how the node should look.
In this case we are saying the Animals node should be red in color drawn as a dot and have the label ‘Animals’ as its label. If you save the changes and refresh the page you will see the following image on screen.
Congratulations you have created your first node!
At this point your page source should look like this :
While creating nodes is useful, it is the links between nodes that give these graphs meaning. We will now introduce relationships between the nodes.
Start by adding two more nodes to the graph as seen below :
var dog = sys.addNode('dog',{'color':'green','shape':'dot','label':'dog'});
var cat = sys.addNode('cat',{'color':'blue','shape':'dot','label':'cat'});
We added a cat and dog with different colors in the code above. If you save refresh the page you will see the following image.

To indicate that the dog and cat are animals we connect them using edges as seen in the code below.
sys.addEdge(animals, dog);
sys.addEdge(animals, cat);

If you save your changes and refresh you will now see that the 3 nodes are connected by edges. When calling sys.addEdge you are specifying which 2 nodes you want to connect. If you wish to customize how the line is drawn you can edit the renderer to draw custom code.
At this point your page source should look like this :
Step3 Page
Getting things done faster and easier
Our methods so far have been very manual and error prone. Arbor provides a method called grafting help automate this.
To use this method you provide arbor with a json object that contains all the nodes and edges that you want to add to screen. Arbor then adds them to the graph correctly.
(In our example we are hardcoding the input data. The graphs on http://cc.thinkst.com achieve this with an ajax call to our backend that returns the data in the correct format) :
Add the following json to the script tag in your page:
var data = {
nodes:{
animals:{'color':'red','shape':'dot','label':'Animals'},
dog:{'color':'green','shape':'dot','label':'dog'},
cat:{'color':'blue','shape':'dot','label':'cat'}
},
edges:{
animals:{ dog:{}, cat:{} }}
};
As you can see the nodes are created the same way as before with all their data attributes. The edges are represented slightly differently: they are structured in such a way that the parent is at the top and all children are contained within. If it had to be show in a tree it would look like this :
animals                     ← The Parent node
dog               ← Child node
cat    ← Child node
To use this json in the code we need to do the following :
Replace all the code in your script tag with :
var sys = arbor.ParticleSystem(1000, 400,1);
sys.parameters({gravity:true});
sys.renderer = Renderer("#viewport") ;
var data = {
nodes:{
animals:{'color':'red','shape':'dot','label':'Animals'},
dog:{'color':'green','shape':'dot','label':'dog'},
cat:{'color':'blue','shape':'dot','label':'cat'}
},
edges:{
animals:{ dog:{}, cat:{} }
}
};
sys.graft(data);
As you can see we have still have to initialize our arbor system and setup the renderer but instead of manually creating each node and linking them with edges we simply call sys.graft with our json object.
Extending Existing data:
Finally it would be nice to hook in more data onto our existing graph as it becomes available. To simulate this we will set a timeout in javascript for 10 seconds , after this our code will be called to add more data to the graph.
Add the code below after your sys.graft(data) :
setTimeout(function(){
var postLoadData = {
nodes:{
joe:{'color':'orange','shape':'dot','label':'joe'},
fido:{'color':'green','shape':'dot','label':'fido'},
fluffy:{'color':'blue','shape':'dot','label':'fluffy'}
},
edges:{
dog:{ fido:{} },
cat:{ fluffy:{} },
joe:{ fluffy:{},fido:{} }
}
};
sys.graft(postLoadData);
},10000);
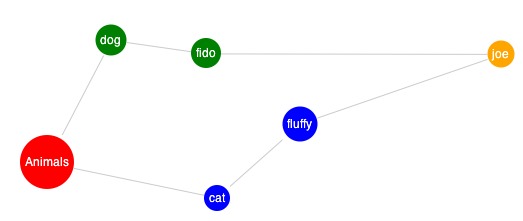
What we are doing above is adding 3 new nodes and then setting up new edges for these nodes. We indicate this in the edges section.
If we didn’t have the sys.graft we would have to iterate over every node that’s currently on screen and check if we need to add new nodes and edges to it. If you save and refresh the page you see a image similar to the one below.

Finally at this point your page source should look like this :
Final Page
The project itself is worth checking out and goes much deeper. Check out the code they have provided on github or drop me a note on email (jameel@thinkst.com) or twitter.
47 comments On Simple Graphs with Arbor.js
Hi,
I have been running arbor.js for many years at https://www.outten.org/nodeTree.php?id=46 Arbor.js was the only thing I could find to fit my needs and has been very successful.
With thanks to the developers.
Xander
thank!!its working…Could you please tell me how to add link to nodes in aroborjs?
Here's a screenshot http://deyan4.com/halfviz.png
Hello, I'm trying to run the halfviz demo, but there are a couple of errors I can't fix.Uncaught ReferenceError: objcontains is not defined in primitives.js.25Uncaught ReferenceError: importScripts is not defined worker.js:7I had to add a couple of scripts, although there were included not in the index.hmtl demo file.What else I have to include? Any ideas?
Way to make something seemingly complex, very simple. Any plans to extend the tutorial such that one can select a node and then do something with it, e.g.. launch a page, add the node (and perhaps its children ) to an array
Hi Is there a way to provide tooltip option for nodes
I'm sure I'm following all the steps but I see nothing. Files are on a server but I see a blank screen. Really would appreciate a nudge in the right direction! Thanks.
Thanks for the tutorial. It is very easy to follow and it works perfectly.I would like to go to an external link by clicking a node. Is it posible?
this is not working….
I have installed xamp and apache is running. My html page has path set to the .js files kept in a folder on my local drive but nothing is getting rendered on my browser. can anybody guide me how to go about doing this correctly for regenerating this example.
Below sys = arbor.ParticleSystem(…) I put “arbor.Graphics = Graphics;”Also you may have to include “colors.js” “etc.js” and “primitives.js”, all those js are in the arbor project.
Hi, may i know how can insert the image in node? Im trying this too…
If anyone has an answer for this, that'd be great!
How Can insert image in node instead of string (name)
Great, I will Try!
Thanks, helpful tutorial.
Hi, Thanks for such a nice tutorial! :)Cheers!
Hey,Even I want to implement a search on my graph. did you find any solution? If yes, please do share. Thanks
very helpful tutorial.. thanks
You just have to specify it while you're adding a new edge.Example: – sys.addEdge(nodeA, nodeB, { directed: true, weight:3 });And yeah you guessed it, you can also change its width.
Did anyone got the chance to get the answer of this question? I'm also stuck with this…
Use JSONhttp://blog.thinkst.com/2011/06/simple-graphs-with-arborjs.html
Another nice example with hover detection: http://d.alliscalm.net/vintro/
Anybody tell me how to use hover event in this graph ???When i move mouse cursor on particular node than i want to display some other nodes…
Can anybody tell me how to hover in this graph ????
Hey did you by any chance get an answer for this question?I am also stuck up here.Kindly let me know asap.Thanks
Thanks for the article..Do you have any clue to make arbor.js work reading data from mysql ?
Thanks a lot, I wasn't able to use Arbor.js before, but finding your tutorial was great and I was able to get a dynamic example of it working with the Wordnik API to generate graphs on the fly.I am having trouble with the pruneNode() function since it asks for a Node and not for the name like add node would. Do you have any idea on how to prune (or delete an existing node).Again thanks a bunch!! for this great tutorial!
thanks dude, this is excellent for getting a basic knowledge
thanks for the tutorial, I enjoyed it very much.
thanks a lot! I was really stumped over this before I found your easy to understand tutorial!
If you are on a Mac or Linux try this. Go to terminal,cd in to the directory where you have the arbor files and execute 'python -m “SimpleHTTPServer”. This will create a webserver for you with the files in the current directory. On Windows, you can either use cygwin + python or download HttpFileServer (HFS) http://www.rejetto.com/hfs/
I want to go to a external link by clicking a node. Can you please provide a sample code for this.
arbors.js library documentation (http://arborjs.org/reference) is really MEAN.To me, projects with poor documentation are worthless.goog luck creators anyway !
Thank you for creating this walkthrough. I would to be able to use arbor but unfortunately am having trouble early trying to get ANYTHING to render. Using the simple code from step 2,https://gist.github.com/1036344/76be0e4b700249e6910d61add6c92ca3932cd0bcnone of my browsers will render the dot. Firefox says that arbor.graphics is not a function, but it is included in the renderer.js file that is provided.Any Ideas? thanks
I sit possible to create a SEARCH function so that the output is revealed as linked nodes as appearing above? Thanks. Michael
Thanks for the tutorial. It is very easy to follow the steps you have mentioned.Part of my project requires rendering Graphs on a web page. This material is very helpful.
Hi. Finally a working tutorial of arbor.js . Kudos for the good job and thanks for breaking it down to digestible sections XD . I would like to know is it hard to transform the lines to arrow. I know there's an example of it in the halfviz but i got lost in the scripts.Again many thanks!
trying to run on tomcat…it just not running.No error also in firebug…any clue
Thank u so much!!! I was having a lot of problems for make it work 😀
Instead of text labels inside the nodes … is it possible to have image or HTML text
Thanks for the article. It was easy to follow except for the sequence that follows your statement “This does 3 things”. The 3 steps that you itemize are actually for the upcoming code instead of the previous 2 lines of code.Anyhow, arborjs seems to have potential but I'm concerned with the memory leaks that I'm seeing in Firefox… it just brings the browser to its knees.
You can alter the Renderer function, but it's not very easy.Arbor also states that I can use html objects like 'div's in my canvas, but i haven't seen an example of how to do this…And Arbor definitely needs to spend some time in making the used subcomponents (like physics) IE compatible. It's a shame… Oh and I'm getting warnings in Firebug, lots of it!
What would be involved to add a label to edges?
Dear Jameel,Do you know how to substitute images instead of dots for the nodes.Thanks
Hi AnonThere are various ways to do this depending on the system you are using. The simplest is to install apache for your system and then copy the files we mentioned in the post to the htdocs folder. You should then be able to access them via http://localhost/.If you need more help feel free to contact me directly.
How do you localy host those documents in the beginning